
Manufacturing generates nearly $14.5 trillion in market value globally each year, with the US sector alone contributing a record $2.8 trillion to GDP in 2023. Despite this scale, manufacturers face challenges, including rising costs, shifting demand, labour and skills shortages, as well as growing cybersecurity threats. In this complex environment, tracking the right key performance indicators (KPIs) for manufacturing is essential. Manufacturing KPIs offer measurable insights into efficiency, safety, quality, and lean manufacturing practices, helping leaders uncover inefficiencies, align with strategic goals, and stay competitive.
This guide outlines the top manufacturing KPI examples every manufacturer must monitor, along with formulas and free checklists.
- What are Manufacturing KPIs?
- Manufacturing KPI Examples
- Production KPIs in Manufacturing
- Lean Manufacturing KPI Examples
- Quality KPIs in Manufacturing
- KPIs for Manufacturing Operations & Efficiency
- Safety KPIs in Manufacturing
- Cost & Financial KPIs for Manufacturing
- How GoAudits Helps Track & Improve Manufacturing KPIs
- How to Choose the Right Manufacturing KPIs to Track
What are Manufacturing KPIs?
Manufacturing key performance indicators (KPIs) are measurable values that track how effectively production operations achieve desired outcomes. They act as performance benchmarks that reflect efficiency, productivity, safety, and quality across the manufacturing process. By monitoring manufacturing KPIs, you gain a clear understanding of how well your operations are functioning and where adjustments are needed to achieve better results.
Why Do You Need to Track Manufacturing KPIs?
Tracking manufacturing KPIs is essential because it allows you to monitor progress toward goals with measurable metrics, ensuring clarity on whether production is moving in the right direction. These indicators can help detect quality issues, bottlenecks, or rising costs before they escalate into bigger challenges.
In addition to data-driven insights, they also ensure accountability across the production department by making performance transparent. When you analyze trends, you identify opportunities for continuous process improvement that enhance productivity and reduce waste. Additionally, benchmarking your KPIs against competitors helps you evaluate your market position and uncover areas where you need to improve to stay competitive.

Manufacturing KPI Examples
Manufacturing KPIs can be divided into 6 categories. These are:
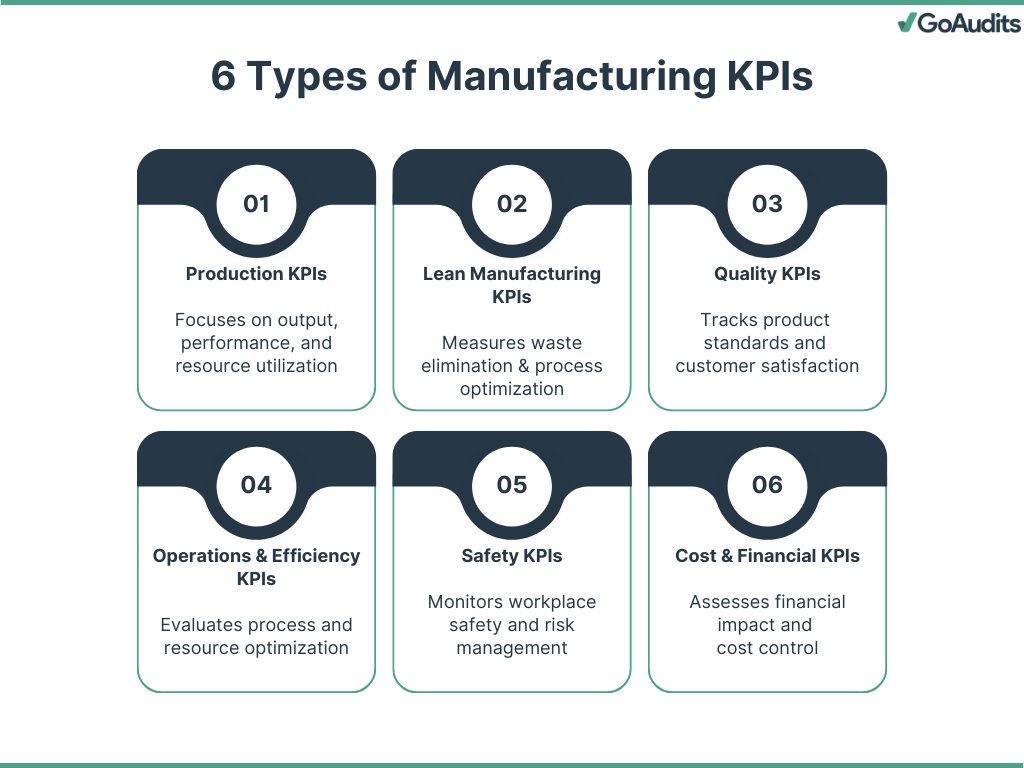
Production KPIs in Manufacturing
They focus on output, performance, and utilization of resources. Common metrics include throughput, machine utilization, production downtime, and capacity utilization. Monitoring these KPIs allows you to evaluate how well production aligns with demand, ensuring that bottlenecks and delays are quickly addressed.
Lean Manufacturing KPIs
Lean manufacturing KPIs measure how well you eliminate waste and optimize processes. Metrics such as overall equipment effectiveness (OEE), cycle time, takt time, and first-pass yield help you identify inefficiencies and streamline workflows. By tracking these indicators, you ensure that resources are used effectively while maintaining value for the customer.
Quality KPIs in Manufacturing
Quality KPIs track how consistently you deliver products that meet standards. Defect density, rework rate, and customer complaints are important indicators. These KPIs provide insight into product reliability and help you detect quality issues early to minimize waste and protect customer satisfaction.
Operations & Efficiency KPIs
Operations and efficiency KPIs measure how well processes, labor, and equipment are optimized. Metrics like overall labor effectiveness (OLE), process cycle efficiency, inventory turnover, and lead time highlight how efficiently operations run. Tracking them enables you to balance resources, improve responsiveness, and maintain smooth production flow.
Safety KPIs in Manufacturing
Safety KPIs monitor workplace safety and risk management practices. Lost-time injury frequency rate, incident rate, near-miss reporting, and compliance with safety training are key metrics. They help you reduce accidents, ensure regulatory compliance, and build a safe working environment for employees.
Cost and Financial KPIs in Manufacturing
They evaluate the financial impact of manufacturing activities. Metrics such as cost per unit, operating margin, return on assets (ROA), and manufacturing cost variance reveal how effectively you control expenses and generate returns. Tracking these KPIs ensures that operational decisions align with financial goals.
👉 Free Resources
GoAudits offers a wide range of manufacturing audit checklists. You can use these ready-to-use checklists to standardize production, quality, or safety checks, tracking scores, and your own internal manufacturing KPIs:
→ SQFI Quality Checklist
→ Production Quality Control Checklist for Manufacturing
→ Quality Control Audit Checklist
→ Manufacturing Quality Control Checklist
→ Vendor Quality Audit Checklist
→ Quality Control Incoming Inspection Checklist

Production KPIs in Manufacturing
Let’s dive deeper into production KPIs.
Capacity Utilization
Capacity utilization shows how much of your available production capacity you are using. It helps you understand if resources such as machinery, labor, and materials are being fully leveraged. A low percentage suggests underuse of resources, while an extremely high rate may indicate strain on the system.
Production Attainment (Schedule Attainment)
Production attainment measures how well you meet your scheduled production targets. It highlights the gap between planned and actual output. Consistently high attainment reflects reliable planning and execution.
Production Volume
Production volume tracks the total number of units produced in a defined period. This KPI is a direct measure of output and is useful for comparing performance across shifts, lines, or facilities.
Production Downtime
Downtime records the total time production stops due to equipment failures, maintenance, or other disruptions. Monitoring downtime helps you uncover recurring issues and reduce lost productivity.
Changeover Time
Changeover time measures how long it takes to switch from producing one product to another. Reducing this KPI improves flexibility, minimizes idle time, and supports just-in-time production strategies.
Work in Process (WIP)
WIP indicates the number of partially finished goods currently in production. High WIP levels often point to inefficiencies, bottlenecks, or imbalances in the workflow. Keeping this number low helps reduce waste and lead times.
Yield Rate
Yield rate represents the percentage of products manufactured correctly without rework or scrap. A high yield rate signals strong process control and product quality, while a low rate suggests defects that need urgent attention.
Lean Manufacturing KPI Examples
Track these manufacturing KPIs to improve performance across different stages of the manufacturing process.
Cycle Time
Cycle time measures the total time required to produce one unit, from the start of production to its completion. Lower cycle times usually indicate a more efficient process. Monitoring this KPI helps you spot bottlenecks and improve workflow.
Throughput Rate
It reflects how many units you produce in a given period. A higher rate shows that your production line is running smoothly and consistently. This KPI directly links to your capacity to meet demand.
On-Time Delivery
It measures your ability to deliver products to customers within the agreed-upon timeframe. A high OTD rate signifies efficient operations, reliable supply chains, and satisfied customers.
OTD (%) = (Number of orders delivered on time / Total number of orders) x 100
Overall Equipment Effectiveness (OEE)
OEE measures how well your equipment performs against its full potential. It combines availability, performance, and quality into a single percentage. High OEE indicates minimal downtime, optimal speed, and consistent output quality. It highlights losses due to breakdowns, slow cycles, and defects.
OEE = Availability x Performance x Quality
Scrap Rate or Rejection Rate
Scrap rate tracks the proportion of materials or products discarded due to defects that cannot be repaired. A high rejection rate indicates process instability and material wastage. Reducing scrap directly improves cost efficiency and sustainability.
Scrapped rate = Scrapped units / Total units produced * 100
First Pass Yield (FPY) or Right First Time (First Time Quality)
FPY measures the percentage of units that meet quality standards without rework or repair. It highlights inefficiencies and reveals opportunities for process improvement. A higher FPY indicates that processes are well-controlled and deliver products correctly the first time.
FPY = Units passing without rework / Total units produced * 100
Quality KPIs in Manufacturing
The following quality KPIs help you monitor and improve manufacturing processes.
Defects Per Unit (DPU) and Defect Density
DPU quantifies the average number of defects per unit produced, while defect density measures the number of defects relative to a defined production measure such as batch size or production volume. They allow you to identify recurring issues and prioritize corrective actions.
DPU = Total defects / Total units produced
Cost of Poor Quality (COPQ)
COPQ captures the financial impact of quality failures, including scrap, rework, warranty claims, and inspection costs. It reflects both internal and external failure costs. Reducing COPQ not only improves profitability but also strengthens brand reputation.
COPQ = Internal failure costs (IFC) + External failure costs (EFC)
Customer Return or Warranty Claims or Customer Complaints Rate
This KPI measures the percentage of products returned or reported defective by customers. It provides a direct measure of product performance in the market, helping you align internal quality with customer expectations and reduce warranty expenses.
Customer complaint rate = Customer complaints or returns / Total units delivered * 100
👉 Find out how GoAudits manufacturing quality control software can help you ensure quality control and assurance across all your production processes.
Supplier Quality Index
It evaluates supplier performance based on defect rates, delivery quality, and compliance with specifications. Strong supplier quality reduces downstream issues and ensures stable production. Tracking this KPI supports effective supplier management and risk reduction.
👉 Free Resources
You can use these free checklists to perform standardized supplier audits and evaluations, manage supplier quality, identify risks, monitor compliance, and maintain consistency across your supply chain.
→ Supplier Evaluation Checklist
→ Supplier Self Assessment Form
→ Food Supplier Audit Checklist
→ ISO 9001:2015 Supplier Audit Checklist – Manufacturing
→ Supplier Corrective Action – Request Form
→ Supplier Quality Audit
→ Supplier Non-Conformance Report
Non-conformance Rate
It indicates the percentage of units or processes that fail to meet defined standards. It includes deviations detected during inspections or audits. A rising non-conformance rate signals systemic issues in process control that require immediate corrective action.
Non-conformance rate = Non-conforming units / Total units inspected * 100
👉 Success Story: Find out how GoAudits helped Nissin Foods digitize dozens of daily manufacturing quality checks that were previously manually handled on paper. With the GoAudits mobile app, they now record inspections in real time, receive instant reports, and log corrective actions directly during audits. This has improved response times and enabled them to achieve over 96% completion rates for GMP audits. In addition to dedicated support from GoAudits, customized reporting formats offered better visibility of recurring issues and enhanced overall compliance with global food safety standards.
KPIs for Manufacturing Operations & Efficiency
The following metrics help identify bottlenecks, reduce waste, and improve productivity.
Percent Unscheduled Downtime
This KPI calculates the proportion of downtime that occurs without prior planning. A high percentage signals unexpected breakdowns and poor preventive maintenance. Monitoring this metric allows you to identify recurring issues and strengthen reliability programs.
Unscheduled downtime (%) = (Total unscheduled downtime / Total planned operating time) x 100%
Mean Time to Repair (MTTR)
MTTR measures the average time required to repair equipment and return it to full operation. A lower MTTR means faster recovery from failures and less production disruption. Tracking MTTR helps evaluate the efficiency of your maintenance team and repair procedures.
MTTR = Total repair time / Number of repairs
Mean Time Between Failures (MTBF)
MTBF represents the average operating time between two equipment failures. A higher MTBF indicates reliable machinery with fewer breakdowns. This metric is essential for scheduling preventive maintenance and forecasting equipment lifespan.
MTBF = Total operating time / Number of failures
Planned Maintenance Percentage (PMP)
PMP shows the share of maintenance hours spent on planned activities compared to total maintenance hours, reflecting the maturity of your maintenance strategy. A higher percentage means your operations rely more on preventive actions than emergency fixes.
PMP = (Planned maintenance hours / Total maintenance hours) x 100
Equipment Downtime Percentage and Downtime Rate
Downtime percentage indicates the portion of scheduled production time lost due to equipment unavailability. Downtime rate measures how often downtime events occur within a given period. Together, these metrics help identify chronic reliability issues and areas for improvement.
Downtime rate (%) = (Total downtime / Planned production time) x 100
Percent Reactive Maintenance and Maintenance Backlog
It tracks the share of total maintenance that is unplanned and corrective. A high value suggests frequent unexpected breakdowns.
Maintenance backlog measures the volume of unfinished maintenance tasks relative to available resources. Keeping this under control prevents production risks and ensures asset reliability.
👉 Free Resources
GoAudits equipment inspection software offers free checklists that can help you standardize equipment inspections, track compliance, and reduce downtime. With digital checklists, report automation, and corrective action tracking, you can identify risks early, maintain equipment reliability, and keep your operations running smoothly.
→ Equipment Inspection Form
→ Machine Preventive Maintenance Checklist
→ Heavy Equipment Preventive Maintenance Checklist
Safety KPIs in Manufacturing
The following KPIs are widely used to evaluate safety effectiveness.
Total Recordable Incident Rate (TRIR)
TRIR measures the number of recordable workplace incidents per 200,000 hours worked. It includes cases that require medical treatment beyond first aid, restricted work, or days away from work. A lower TRIR indicates better safety performance. This KPI allows you to benchmark your safety record against industry standards.
TRIR = (Total number of recordable incidents & illnesses * 200,000) / Total number of annual worked hours
Lost Time Injury Frequency Rate (LTIFR)
LTIFR calculates the number of lost time injuries per one million hours worked. It highlights the frequency of incidents severe enough to cause employees to miss work. Tracking LTIFR helps you identify high-risk areas and evaluate the effectiveness of preventive measures.
LTIFR = (Number of lost time injuries / Total hours worked) x 1,000,000
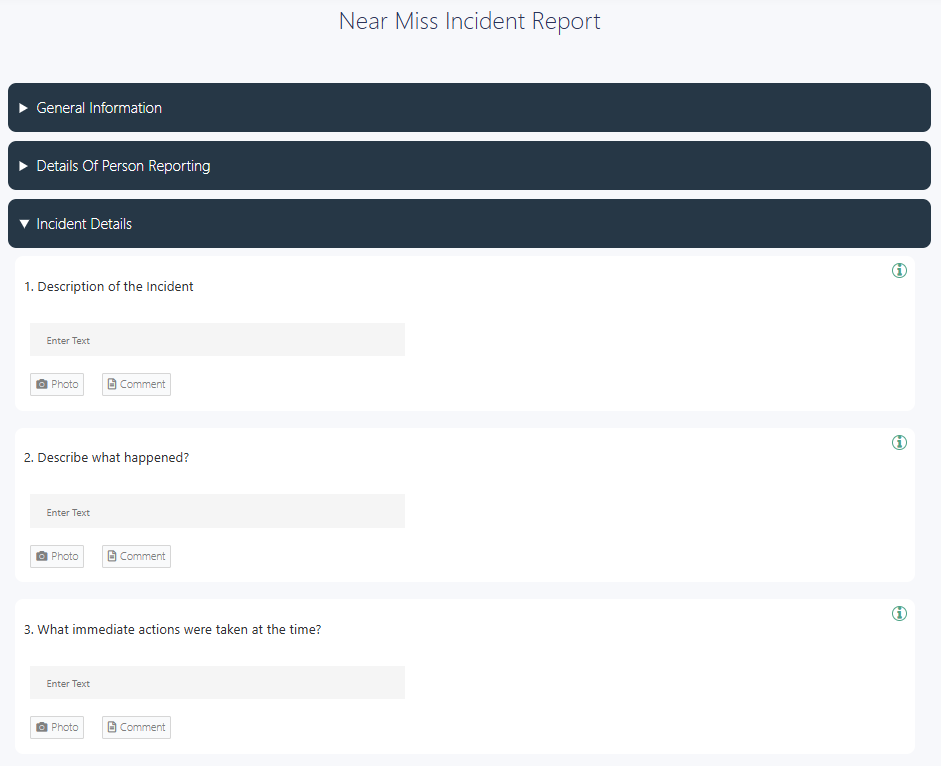
Near Miss Frequency Rate (NMFR)
Near misses are events that could have resulted in injury but did not. Measuring their frequency gives you insight into potential hazards before they cause harm.
NMFR = (Number of near misses x 200,000) / Total hours worked
A high near miss reporting rate often reflects a strong safety culture where employees feel encouraged to report risks.
👉 Find out how GoAudits near miss reporting software can help you simplify the process of reporting near misses using digital near miss incident reporting checklists.
Safety Training Completion Rate
It tracks the percentage of employees who complete mandatory safety training within a defined period. High completion rates ensure that your workforce is aware of hazards, understands safe work practices, and complies with regulatory requirements. Monitoring this rate also reveals training gaps that may increase risk exposure.
Corrective and Preventive Actions (CAPA) Closure Rates
CAPA measures how effectively your organization addresses identified safety issues. Corrective actions resolve current problems, while preventive actions stop them from recurring.
👉 Use GoAudits CAPA management software to perform CAPA audits and generate CAPA reports instantly using CAPA audit checklists.
Tracking this KPI ensures accountability and demonstrates continuous improvement in safety management systems.
👉 Free Health & Safety Checklists

Cost & Financial KPIs for Manufacturing
Below are essential cost and financial KPIs grouped into four categories.
Cost Efficiency KPIs
- Production Cost per Unit measures the total cost of producing a single unit. It includes raw materials, labor, and overhead. Tracking it helps you identify process inefficiencies and opportunities to reduce unit costs.
- Cost of Goods Sold (COGS) represents the direct costs of producing goods, such as materials and labor. Monitoring it ensures accurate pricing decisions and clear insights into profitability.
- Maintenance Cost per Unit tracks the average maintenance expense allocated to each unit produced. High values may indicate aging equipment, inefficient maintenance schedules, or over-reliance on reactive repairs.
- Unused Capacity Cost reflects the cost of idle resources, such as underutilized machines or labor. A high unused capacity cost indicates inefficiency in resource planning and scheduling.
- Overtime Rate/Hours shows how effectively workforce planning is managed. Excessive overtime can increase labor costs and reduce productivity over time.
- Avoided Cost represents expenses saved due to preventive measures. For example, preventive maintenance reduces breakdowns and associated downtime costs.
- Energy Cost per Unit calculates the energy cost required to produce one unit. It helps you assess energy efficiency and identify opportunities for cost reduction through process optimization or energy-saving technologies.
Profitability KPIs
- Operating Profit Margin measures the profitability of operations after deducting operating expenses. It reflects how efficiently you convert revenue into operating profit.
- Gross Profit Margin shows the percentage of revenue remaining after subtracting COGS. It indicates how effectively production and sourcing costs are managed.
- Return on Investment (ROI) evaluates the return generated on invested capital. In manufacturing, it can measure returns on machinery, technology upgrades, or process improvements.
Liquidity & Working Capital KPIs
- Working Capital is the difference between current assets and current liabilities. Positive working capital indicates sufficient liquidity to cover short-term obligations.
- The Current Ratio or Quick Ratio compares current assets to current liabilities. The quick ratio excludes inventory for a stricter measure of liquidity. Both indicate the ability to meet short-term financial commitments.
Cash Flow & Asset Efficiency KPIs
- Cash-to-Cash Cycle Time tracks the time taken to convert raw material purchases into cash collected from sales. Shorter cycles reflect better cash flow management and operational efficiency.
- Inventory Turnover shows how often inventory is sold and replaced during a period. A higher turnover indicates efficient inventory management and reduced carrying costs.
- Days sales outstanding (DSO) measures the average number of days it takes to collect payment after a sale. A lower DSO improves liquidity and reduces the risk of bad debts.
How GoAudits Helps Track & Improve Manufacturing KPIs
KPIs tell you what’s wrong. GoAudits manufacturing inspection software helps you monitor and fix them fast. Measure compliance, spot trends, and take corrective action faster:
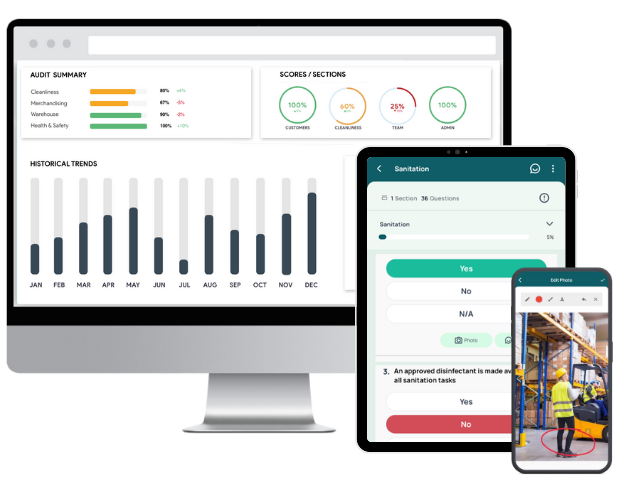
- Digital Checklists: Eliminate paperwork, standardize quality, safety, and Lean inspections.
- Real-Time Reports: Instantly track non-conformances, downtime, or scrap issues.
- Corrective Actions: Assign and follow up on root-cause fixes.
- Audit Workflow: set up notifications, approvals, and reminders to reduce errors and boost accountability.
- Case Example: Discover how HTS streamlined safety and quality assurance processes with GoAudits, “getting ahead of the trends before they become a gross non-conformance”.
How to Choose the Right Manufacturing KPIs to Track
To identify KPIs that truly matter, follow these best practices:
Align KPIs with Strategic Goals & Prioritize
Start by connecting KPIs directly to your organization’s strategic objectives. If your goal is to reduce production costs, focus on metrics such as scrap rate, overall equipment effectiveness, or labor productivity. When KPIs support broader goals, you avoid tracking irrelevant data and ensure every metric contributes to measurable progress.
Tracking too many KPIs creates noise and dilutes focus. Select only those that offer actionable insights and align with business priorities. For example, rather than monitoring every possible quality metric, prioritize first-pass yield or defect rates if quality improvement is your main objective.
Apply the SMART Framework
Use the specific, measurable, achievable, relevant, and time-bound (SMART) framework to filter potential KPIs. For example, instead of tracking ‘improve output’, define a KPI like ‘increase production volume by 10% in the next quarter’. This makes the metric clear, realistic, and actionable.
Balance Leading and Lagging Indicators
Include both leading indicators (e.g., machine downtime, maintenance schedules) and lagging indicators (e.g., units produced, delivery performance). Leading indicators highlight potential issues before they occur, while lagging indicators confirm outcomes. A balanced approach provides both foresight and validation.
Choose Reliable Data Sources & Reporting Tools
Accurate KPIs depend on trustworthy data. Identify reliable systems, such as manufacturing execution systems (MES), ERP platforms, or IoT-enabled sensors, that provide consistent and real-time data. Inconsistent or outdated data can mislead decision-making and erode confidence in reporting.
Use reporting tools that present KPIs in clear, accessible dashboards. Visualizing data helps stakeholders interpret trends quickly and respond effectively. Automated reporting also reduces manual effort and ensures updates remain timely.
Benchmark Against Industry Standards
Compare your KPIs with industry benchmarks to understand your competitive position. Benchmarking reveals whether performance gaps stem from internal inefficiencies or reflect common industry challenges. This helps set realistic targets.
Review and Refine Regularly
Manufacturing priorities and external conditions change. Review KPIs periodically to ensure they remain aligned with current goals. Retire metrics that no longer provide value and introduce new ones when business strategies evolve.