
Private industry employers reported 2.6 million nonfatal workplace injuries and illnesses in 2023, marking an 8.4% decline from 2022, according to the US Bureau of Labor Statistics. While this trend suggests progress in workplace safety, injuries remain a significant concern for businesses across industries. One of the key metrics used to assess workplace safety and ensure compliance with safety regulations is the OSHA total recordable incident rate (TRIR).
This blog will help you understand what the TRIR safety metric is, how to calculate it, and why it matters for both your organization and employees. It’ll also explore best practices for reducing workplace hazards, lowering incident rates, and improving TRIR.
- Understanding Total Recordable Incident Rate (TRIR)
- How Does OSHA Define TRIR?
- Steps to Calculating Total Recordable Incident Rates
- Average TRIR by Industry
- How to Improve TRIR?
- Prevent Workplace Incidents with a Safety Inspection App & Software
- Free Health & Safety Checklists to Ensure Employee Safety
- Importance of TRIR in Health & Safety
- Calculating Total Recordable Incident Rates: Challenges & Solutions
- TRIR vs EMR: Key Differences
- What is the Difference Between DART and TRIR?
- What is the Difference Between LTI and TRIR?
Understanding Total Recordable Incident Rate (TRIR)
The Total Recordable Incident Rate (TRIR) is a standardized metric used to evaluate a company’s safety performance by quantifying work-related injuries and illnesses. It represents the number of recordable incidents per 100 full-time employees over a one-year period.
It gives organizations a consistent method to assess and monitor their safety performance over time. Calculating TRIR helps them identify trends in workplace injuries and illnesses, benchmark their safety performance against industry standards, and prioritize targeted safety improvement initiatives.
What constitutes a recordable incident?
A recordable incident refers to any work-related injury or illness that meets specific criteria established by the Occupational Safety and Health Administration (OSHA). These incidents include:
- Fatalities
- Injury or illness that results in loss of consciousness
- Cases resulting in days away from work
- Restricted work activities
- Job transfers
- Medical treatment beyond first aid
- Fractured or cracked bones or teeth and punctured eardrums
- Diagnosed cancer and chronic irreversible diseases
👉 What is a Good TRIR?
Determining what constitutes a good TRIR depends on industry standards and specific company goals. Generally, a TRIR below the industry average is considered favorable. For many industries, a TRIR of 3.0 or lower is deemed good, while a TRIR above 4.0 may indicate a need for safety improvements. However, these benchmarks can vary, so it’s essential to compare your TRIR to industry-specific data.
How Does OSHA Define TRIR?
OSHA defines the TRIR as a metric to assess a company’s safety performance. It represents the number of recordable incidents per 100 full-time employees over a one-year period.
Here’s the total recordable incident rate formula:
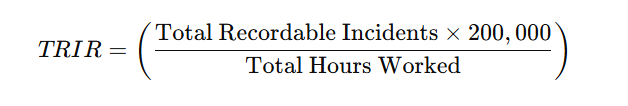
According to OSHA, the number 200,000 represents the total hours 100 full-time employees would work in a year (40 hours per week × 50 weeks per year), providing a standard base for comparison.
Consider a company that experienced 5 recordable incidents in a year and had a total of 250,000 hours worked by all employees.
TRIR = (5 × 200,000 / 250,000) = 4.0
This means the company had a TRIR of 4.0, indicating 4 recordable incidents per 100 full-time employees during that year.
Steps to Calculating Total Recordable Incident Rates
Here are the steps to calculate total recordable incident rates:
- Determine the Number of Recordable Incidents
Identify all work-related injuries and illnesses that meet OSHA record-keeping criteria. These include incidents resulting in death, loss of consciousness, days away from work, restricted work activity, job transfer, or medical treatment beyond first aid.
- Calculate Total Hours Worked
Sum the total number of hours worked by all employees during the year. Exclude non-working hours such as vacation, sick leave, and holidays. Include hours worked by temporary or contract workers if they are under your direct supervision.
- Apply the TRIR Formula
Use the total recordable incident rate formula for calculations.
Assume your company had 5 recordable incidents and employees worked a total of 500,000 hours in a year.
TRIR = (5 x 200,000 / 500,000) = 2.0
This means there were 2 recordable incidents per 100 full-time employees during the year.

How Often Should You Calculate TRIR?
You can use the TRIR formula for any chosen timeframe. For a quarterly rate, just total the recordable incidents from that quarter, multiply by 200,000, and divide by the total hours worked during those three months.
Shorter periods can yield skewed results, especially for smaller organizations. Even a single incident can greatly affect the TRIR. That’s why most organizations track TRIR over longer intervals, unless they’re dealing with a large project or a workforce logging very high total hours.
How to Calculate TRIR Monthly?
The same formula above works for any time duration, including monthly TRIR calculation. However, generally speaking, calculating a monthly TRIR is not advisable, especially for smaller organizations, because even a single incident may have a huge impact on your TRIR.
For example:
If a single recordable incident took place in a month, in an organization with 100 employees who work 160 hours each in a month:
Total hours = 100 × 160 = 16,000
TRIR = (1 × 200,000) / 16,000 = 12.5
12-Month Rolling TRIR Calculation
A 12-month rolling TRIR calculation is calculated by taking the total number of recordable injuries or illnesses from the past 12 months. In simple terms, the 12-month rolling total recordable incident rate is calculated using the standard TRIR formula applied to a dynamic 12-month window that updates monthly.
- Define the Rolling Period
Use the most recent 12 months of data (e.g., February 2024 to January 2025 for a February 2025 report).
- Gather Data
Gather total OSHA-recordable incidents in the past 12 months and calculate the total hours employees have worked during the same 12-month period.
- Apply the Formula
TRIR = (Total recordable incidents in 12 months × 200,000) / Total hours worked in 12 months
Let’s look at an example.
Recordable incidents in the past 12 months: 10
Total hours worked: 500,000
TRIR = (10 x 200,000 / 500,000) = 4.0
👉 Unlike a standard annual TRIR, which only looks at data from a single year, a rolling TRIR provides a more current picture by constantly updating the calculation as new data becomes available.
Tracking the rolling TRIR over time can help identify trends in safety performance and pinpoint areas where improvements are needed.
Average TRIR by Industry
TRIR benchmarks vary significantly across industries due to differing operational risks.
Average TRIR for construction
The construction sector is characterized by high-risk activities, leading to a notable TRIR. According to data, the average TRIR for the construction industry was recorded at 2.3 in 2023 – a slight improvement from 2.4 in 2022. Specific subsectors exhibit even higher rates; for instance, roofing has a TRIR of 5.0, and framing reports a TRIR of 4.7. Common incidents contributing to these figures include falls, slips, and trips, accounting for about 33% of injuries.
👉 OSHA identifies the ‘Focus Four’ hazards – falls, struck-by incidents, caught-in/between accidents, and electrocutions – as the leading causes of fatalities and serious injuries in the industry.
Average TRIR for Manufacturing
The manufacturing industry reports an average TRIR of 2.8 in 2023.
In 2023, total recordable cases in manufacturing declined to 355,800, down from 396,800 in 2022. The TRC incidence rate also fell to 2.8 cases per 100 full-time workers in 2023, compared to previous years. Additionally, total injury cases in manufacturing dropped by 21,400, reaching 326,400 cases in 2023.
A significant 35% of injuries in manufacturing result from overexertion and bodily reactions, making ergonomics and machine guarding critical safety priorities.
How to Improve TRIR?
A lower TRIR not only reflects a safer work environment but also enhances your company’s reputation and compliance standing. Implement the following strategies to reduce your organization’s TRIR:
1. Analyze Incident Patterns and Root Causes
Begin by thoroughly investigating past incidents to identify common patterns and underlying causes. Use historical data to forecast high-risk scenarios, enabling proactive measures to prevent future occurrences. This allows for targeted interventions, reducing the likelihood of repeat incidents.
2. Conduct Regular Risk Assessments
Use risk assessment apps to perform routine risk assessments to identify and mitigate potential hazards. Encourage employees to report incidents and hazards promptly, fostering a culture of safety and vigilance. Regular assessments help in the early detection of risks, allowing for timely corrective actions.
3. Implement Comprehensive Safety Training
Develop and maintain a robust safety training program that educates employees on best practices and hazard recognition. Ensure that training is participatory, relevant, and tailored to address the specific risks associated with various roles within the organization. Regularly update the training content to reflect new safety protocols and lessons learned from past incidents.
4. Focus on Leading Indicators
Shift attention from lagging indicators to leading ones, such as near-miss reporting rates, training completion percentages, and hazard correction timelines. Monitoring these proactive measures provides insight into potential issues before they result in recordable incidents.
5. Set Benchmarking Goals
Establish clear, measurable safety objectives based on industry standards and your organization’s historical performance. Regularly track progress towards these goals, and adjust safety policies and practices as needed to foster continuous improvement.
6. Ensure Management Accountability
Cultivate a safety-first culture by holding management accountable for safety performance. Leadership should actively participate in safety initiatives, model safe behaviors, and allocate necessary resources to support safety programs. Visible commitment from management reinforces the importance of safety at all organizational levels.
Prevent Workplace Incidents with a Safety Inspection App & Software
Enhancing workplace safety is crucial for reducing incidents and improving your organization’s TRIR. GoAudits safety inspection app & software is designed to help you streamline your safety protocols and foster a safer work environment. Here’s how you can use it to identify hazards, implement corrective actions, monitor outcomes effectively, and enhance workplace safety.
- Use pre-built templates or customize them to conduct thorough inspections on the go whether you’re online or offline.
- Attach photos, annotate them, and capture time-stamped, geo-located data, ensuring detailed and accurate records and transparency.
- Generate detailed reports immediately after each inspection. Customize these reports to meet your specific requirements and share them automatically with relevant team members for quick review and action.
- Assign corrective actions during inspections to specific team members directly from within the app.
- Set up custom workflows to share reports, send reminders, and track task completion.
- Gain a comprehensive overview of your safety performance with smart, interactive dashboards.
- Analyze historical trends, monitor action completion, and identify areas for improvement.
Free Health & Safety Checklists to Ensure Employee Safety
GoAudits offers a wide range of health & safety audit checklists. You can sign up for free and start using these checklists.
- Electrical Safety Inspection Checklist
- Near Miss Incident Report
- Property Fire Risk Assessment
- Fire Risk Assessment Checklist – UK
- Ergonomic Risk Assessment Template
- Worksite Incident Report Checklist
- Chemical Safety Checklist – COSHH
- Chemical Risk Assessment Template
- Office Hazards Checklist
- Accident Investigation Checklist
- Workplace Safety Audit Checklist
- Hazard Identification Form
- Job Safety Analysis (JSA) Checklist
Importance of TRIR in Health & Safety
Understanding the importance of TRIR in health and safety can significantly enhance workplace safety and operational efficiency.
- Benchmarking Against Industry Standards
TRIR serves as a benchmark, allowing organizations to measure their safety performance against industry standards. Calculating TRIR can help you identify areas needing improvement and implement targeted safety measures. However, it’s essential to recognize that TRIR has limitations and should not be the sole measure of safety performance.
- Measuring Safety Performance
Regular monitoring of TRIR provides a clear picture of your organization’s safety performance. A lower TRIR indicates fewer recordable incidents, reflecting effective safety protocols and a commitment to employee well-being. Conversely, a higher TRIR signals the need for immediate attention to safety practices.
- Trend Analysis
Analyzing TRIR over time helps in addressing potential hazards before they result in incidents and identifying trends in workplace incidents. Recognizing upward or downward patterns enables proactive adjustments to safety programs.
- Risk Mitigation
Pinpointing areas with higher incident rates can help you implement targeted interventions to reduce risks, preventing future occurrences and promoting a safer work environment.
- Regulatory Compliance
Maintaining a low TRIR is often essential for demonstrating regulatory compliance and reducing the likelihood of penalties or legal issues. Regulatory bodies may scrutinize TRIR to assess adherence to safety standards and procedures.
- Operational Efficiency
Safety and operational efficiency are closely linked. A lower TRIR often correlates with fewer disruptions due to fewer incidents, leading to smoother operations and increased productivity. Investing in safety measures that reduce TRIR can enhance overall operational performance.
- Cost Reduction
Fewer incidents mean lower expenses related to medical treatments, workers’ compensation, and potential litigation. Additionally, a strong safety record can decrease insurance premiums, further contributing to financial efficiency and savings.
- Improving Safety Culture
Focusing on TRIR fosters a culture of safety within the organization. Regularly tracking and discussing TRIR emphasizes the importance of safety, encouraging employees to engage in safe practices and report potential hazards.
Calculating Total Recordable Incident Rates: Challenges & Solutions
Several challenges can complicate the process of calculating TRIR, including the following:
- Data Accuracy and Completeness: Accurate TRIR calculations depend on comprehensive data collection regarding recordable incidents and total hours worked. Inaccuracies can arise from underreporting or overreporting incidents. Organizations may fail to report minor injuries or misclassify incidents that should be recorded, leading to skewed TRIR values.
- Definition Variability: The definition of what constitutes a ‘recordable incident’ can vary across industries and organizations. According to OSHA, a recordable incident includes work-related injuries or illnesses requiring medical treatment beyond first aid. However, differences in interpretation can lead to inconsistencies in reporting.
- Statistical Validity: TRIR is often criticized for its statistical limitations. The infrequency of recordable incidents in many workplaces means that small changes in incident numbers can lead to large fluctuations in TRIR. This raises concerns about the reliability of TRIR as a comparative measure between companies or industries.
- Impact of Company Size: Smaller organizations may experience disproportionately high TRIR values due to having fewer employees. A single incident can significantly impact their rate, making it appear worse than larger organizations with more extensive workforces and similar incident numbers. This necessitates careful interpretation of TRIR data, especially for small businesses.
- Misleading Precision: Reporting TRIR to multiple decimal points is statistically invalid unless based on a substantial amount of data (e.g., hundreds of millions of worker hours). Many companies report TRIR with precision which suggests a level of accuracy that the data does not support, which can mislead stakeholders about safety performance.
- Lagging Indicator Limitations: As a lagging indicator, TRIR reflects past performance rather than predicting future safety conditions. Relying solely on TRIR can lead organizations to overlook proactive safety measures and improvements needed to prevent future incidents.
TRIR vs EMR: Key Differences
The table below highlights the key differences between TRIT and Experience Modification Rate (EMR).
| Aspect | TRIR | EMR |
| Definition | Measures the frequency of OSHA-recordable workplace incidents per 100 full-time employees annually. | Used by insurance companies to assess past workers’ compensation claims and determine future insurance premiums. |
| Purpose | Helps organizations monitor safety performance and benchmark against industry standards. | Encourages businesses to improve safety by adjusting insurance costs based on claims history. |
| Calculation Formula | TRIR = (Total Recordable Incidents ÷ Total Hours Worked) × 200,000 | Calculated based on actual vs. expected losses, considering payroll size, claim frequency, and industry classification. |
| Who Calculates It? | Calculated internally by companies and reported for OSHA compliance. | Primarily calculated by the National Council on Compensation Insurance (NCCI) in most states. |
| Time Frame | Covers a single year (annual reporting). | Based on a three-year rolling average, excluding the most recent year. |
| What It Measures | Incident frequency – How often workplace injuries and illnesses occur. | Claim severity & financial impact – How costly and severe incidents are over time. |
| Industry Benchmarking | The Bureau of Labor Statistics (BLS) provides industry averages for TRIR comparison. | An EMR of 1.0 is industry average; below 1.0 indicates a better safety record, while above 1.0 suggests higher risk. |
| Factors Considered | Number of OSHA-recordable incidents, total hours worked. | Payroll size, industry classification, claim frequency, and severity. |
| Types of Incidents Counted | Fatalities, lost workdays, restricted work or job transfers, medical treatment beyond first aid, loss of consciousness, serious illnesses or injuries diagnosed by a healthcare professional, etc. | Only considers incidents that result in workers’ compensation claims and their costs. |
| Impact on Business | A high TRIR may trigger OSHA inspections, fines, and loss of contract opportunities. | A high EMR leads to higher workers’ compensation insurance premiums, increasing operating costs. |
| Limitations | Does not measure severity (minor and major incidents count equally), and doesn’t factor in financial costs. | – Takes time to update (changes in safety performance take years to reflect). – Complex formula can result in errors. |
| How to Improve? | Strengthen workplace safety programs, reduce OSHA-recordable incidents, and Conduct regular safety training and audits. | Minimize workplace injuries and workers’ compensation claims, improve return-to-work programs, and manage claims effectively to reduce costs. |
What is the Difference Between DART and TRIR?
Days Away, Restricted, or Transferred (DART) and TRIR are key workplace safety metrics. Both assess employee injury rates but focus on different aspects – TRIR reflects overall injury frequency, while DART measures injury severity.
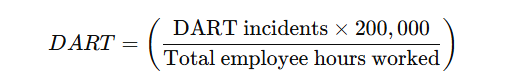
👉 Both formulas use 200,000 hours, representing the total hours worked by 100 full-time employees annually. This standardizes comparisons across companies and industries.
TRIR measures the total number of OSHA-recordable incidents within a specific period. It Includes all work-related injuries and illnesses requiring more than first aid, regardless of time away from work. A high TRIR suggests a need to strengthen safety protocols.
DART measures the number of recordable incidents resulting in days away, job restrictions, or transfers. It focuses on injuries that significantly affect work status.
DART assesses injury severity and impact on productivity, identifies high-risk departments or processes, and encourages proactive safety measures to reduce severe injuries. A high DART rate indicates more severe injuries affecting employee well-being.
👉 Lower TRIR and DART rates indicate a safer work environment with fewer and less severe injuries.
What is the Difference Between LTI and TRIR?
Lost Time Injury (LTI) and TRIR are key workplace safety metrics, but they measure different aspects of workplace incidents.
LTI refers to a workplace injury that prevents an employee from performing their regular duties for at least one full day after the incident (excluding the day of the injury). LTI focuses on the impact of workplace injuries on productivity and workforce efficiency. It helps assess safety performance by identifying trends in serious injuries requiring time off.
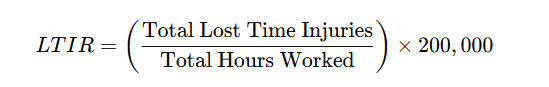
TRIR measures all workplace incidents that meet OSHA’s recordable criteria, including:
- Lost time injuries (LTI)
- Restricted work cases
- Medical treatment beyond first aid
Here are the key differences between LTI and TRIR:
| Aspect | TRIR | LTIR |
| What It Measures | All OSHA-recordable workplace injuries & illnesses | Only injuries causing lost workdays |
| Scope | Includes minor injuries, restricted work, and medical treatment cases | Focuses on severe injuries leading to missed work |
| Values | Higher, since it counts more cases | Lower, as it only tracks serious injuries |
| Usage | Provides a broad view of workplace safety performance | Evaluates productivity loss due to workplace injuries |
| Trends | Identifies safety risks early | Measures the direct impact of injuries on operations |