
Tracking the right health and safety key performance indicators (KPIs) is essential for building a proactive risk management culture. Instead of overwhelming your systems with countless metrics, focusing on the most relevant ones allows you to detect early warning signs, correct course, and protect your workforce before incidents occur. HSE KPIs are measurable signals of your organization’s risk posture. When chosen wisely, they highlight trends, expose vulnerabilities, and support informed decisions. However, tracking every available metric can dilute attention, delay response, and obscure what truly matters. That’s why, selecting KPIs that align with your specific hazards, operational context, and strategic goals can ensure that your safety efforts are not only compliant but also effective and rooted in meaningful insight.
This blog will explore the right health and safety KPIs, how they’re calculated, why they matter, and how you can choose the right ones to track.
What are Health and Safety Key Performance Indicators?
Health and safety key performance indicators (KPIs) are quantifiable metrics used to set objectives to maintain a safe and healthy workforce and assess the performance of safety initiatives within an organization. They are benchmarks to track progress toward safety goals, improve their occupational health and safety (OHS) performance, identify trends, and make informed decisions to mitigate risks. Analyzing these indicators can help you proactively address potential hazards and create a culture of continuous improvement in workplace safety.
Here’s why tracking HSE KPIs is crucial:
- By identifying potential hazards through KPIs, you can implement corrective actions to reduce the likelihood of accidents.
- Ongoing analysis and regular monitoring can enhance safety performance and encourage a culture of safety within your organization.
- Proactive safety management minimizes the financial impact of workplace accidents and injuries.
- Tracking HSE KPIs helps you stay compliant with safety regulations, avoiding potential legal issues.
- A safe work environment leads to higher employee satisfaction and retention.
- They provide objective data that inform your safety strategies and policies.
- Analyzing HSE performance indicator trends can highlight areas where additional employee training is necessary.
- They allow you to assess the success of implemented safety initiatives and make necessary adjustments.
- Regular reporting on KPIs creates a sense of responsibility among staff and management for maintaining safety standards.
Difference Between Leading and Lagging Indicators
Understanding the distinction between leading and lagging indicators is essential for a comprehensive safety management approach.
Leading indicators are proactive, preventive measures that provide insight into the effectiveness of safety processes before incidents occur. They help you identify and mitigate potential risks and implement corrective actions to prevent accidents. Common examples include:
- Frequency of safety training sessions
- Number of safety audits conducted
- Employee participation in safety programs
- Timeliness of hazard reporting and resolution
Lagging indicators are reactive measures that reflect the outcomes of past safety performance. They provide data on incidents that have already occurred, helping you assess the effectiveness of existing safety measures. Some examples are:
- Number of workplace injuries or illnesses
- Lost workdays due to accidents
- Workers’ compensation claims
- Regulatory fines or violations
While lagging indicators offer valuable insights into historical safety performance, they do not predict future incidents.

Top 15 Health and Safety KPI Examples
Below are some of the most important health and safety KPIs you should track:
1. Reported Incidents, Accidents, and Near Misses
Tracking all reported incidents, including accidents and near misses helps you understand the frequency and types of unsafe events occurring in your workplace.
- Incidents: Any unplanned event that results in or could have resulted in injury, illness, or property damage.
- Accidents: Events that cause actual harm or damage.
- Near Misses: Incidents that could have caused harm but didn’t. They are important for proactive risk management. You can use GoAudits near miss reporting software to simplify the process of tracking and reporting near misses in your workplace.
2. Total Recordable Incident Rate (TRIR)
TRIR measures the number of OSHA-recordable incidents per 100 full-time employees over a year. It provides a standardized way to compare safety performance across industries.
TRIR = (Number of Recordable Incidents × 200,000) / Total Hours Worked
Here, 200,000 represents the total hours worked by 100 full-time employees annually.
You can use this HSE KPI to benchmark against industry standards. A lower TRIR means better incident prevention and safety program effectiveness.
3. Lost Time Injury Rate (LTIR) and Lost Time Injury Frequency Rate (LTIFR)
Though both metrics focus on incidents that result in employees missing work, they offer different perspectives.
LTIR calculates the number of lost time injuries per 100 full-time employees annually.
LTIR = (Number of Lost Time Injuries × 200,000) / Total Hours Worked
LTIFR measures the frequency of lost time injuries per 1 million hours worked.
LTIFR = (Number of Lost Time Injuries × 1,000,000) / Total Hours Worked
They help assess the frequency of injuries that disrupt business operations and the effectiveness of safety programs in preventing serious incidents. You can use them to pinpoint unsafe processes and reduce operational downtime.
4. Lost Time Incident Severity Rate (LTISR)
LTISR evaluates the severity of lost time injuries by calculating the number of days lost due to such incidents per 200,000 working hours.
LTISR = (Total Days Lost × 200,000) / Total Hours Worked
This health and safety KPI provides insight into the impact and long-term consequences of workplace injuries on productivity and can guide efforts to mitigate severe incidents.
5. Days Away, Restricted, or Transferred (DART)
DART rate focuses on work-related injuries and illnesses that result in days away from work, restricted duties, or job transfers.
DART Rate = (Number of DART Incidents × 200,000) / Total Hours Worked
This HSE KPI reflects the broader operational impact of serious safety incidents. You can track the DART rate to reduce injury-related productivity losses.
6. Corrective and Preventive Actions (CAPA)
Reactive fixes don’t prevent recurrence. CAPA refers to systematic processes aimed at identifying, addressing, and preventing the recurrence of safety incidents or non-conformities. CAPA ensures you tackle the underlying causes, not just the symptoms.
Key metrics you should monitor:
- Number of CAPAs Initiated
- Time taken to close these corrective actions
- Recurrence rate of incidents after CAPA implementation
👉 Try GoAudits CAPA management software to monitor CAPA and ensure that safety issues are not only addressed promptly but also underlying causes are effectively mitigated, reducing the likelihood of future incidents.
7. Average Resolution Time (ART)
ART measures the average duration taken to resolve reported safety incidents from the time of reporting to closure.
ART = Total time to resolve incidents / Number of incidents
A shorter ART indicates efficient incident management and a responsive safety system. Regularly analyzing ART helps identify bottlenecks in the resolution process and areas needing resource allocation.
8. Equipment Breakdown Frequency
This health and safety KPI tracks the number of times equipment fails or malfunctions within a specific period. Key data points can include:
- Number of breakdowns per month or quarter
- Downtime per breakdown
- Root cause analysis outcomes
Frequent equipment breakdowns can lead to safety hazards and operational delays. Monitoring equipment breakdown frequency helps schedule preventive maintenance and ensure equipment reliability.
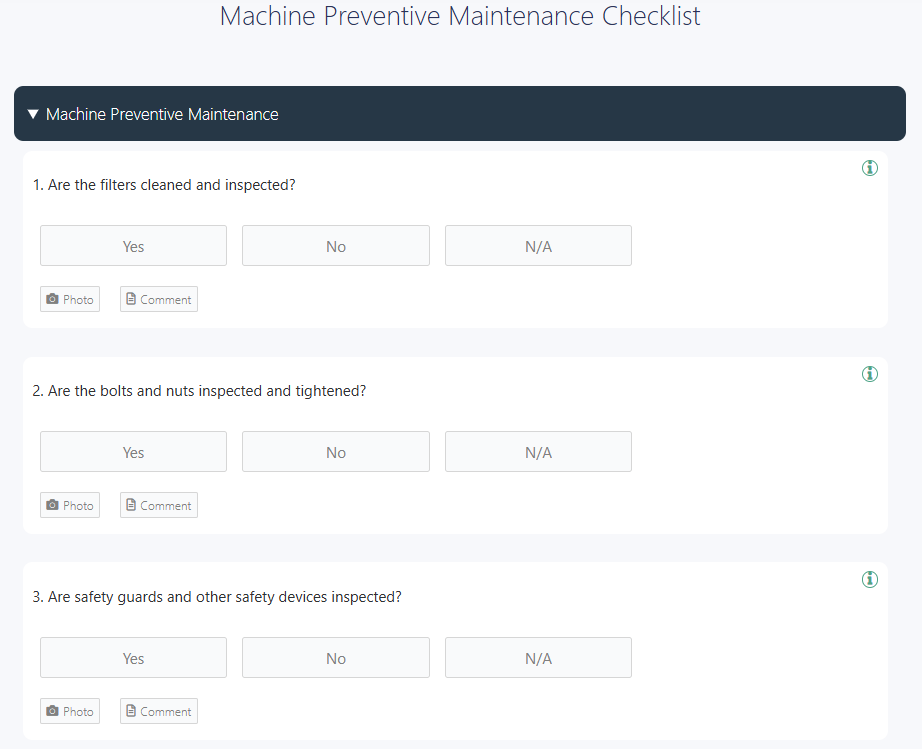
👉 GoAudits equipment inspection software offers this free machine preventive maintenance checklist. You can use this checklist to inspect the reliability of machinery, identify potential hazards, and improve the overall performance of the equipment.
9. Number of Safety Violations and Penalties Paid
This safety KPI records the count of safety regulation breaches and the associated financial penalties incurred over a defined timeframe. You should monitor the number of violations identified during audits, the severity level of each violation, and the total penalties paid. A high number of violations or penalties indicates lapses in safety compliance and can have financial and reputational repercussions. Tracking this metric helps in identifying non-compliance patterns and implementing corrective training or policy changes.
10. Employee Attendance Rate
Although indirect, employee attendance rate can signal underlying safety issues such as workplace injuries, poor morale, or burnout.
Attendance rate = (Number of unexpected absences / Total scheduled workdays) x 100
Low attendance may indicate unsafe working conditions or job dissatisfaction, both of which undermine a strong safety culture.
11. Employee Perception of Management Commitment
This HSE performance indicator assesses how employees perceive management’s dedication to safety. A positive perception often correlates with higher safety compliance and proactive hazard reporting. Here’s how to measure it:
- Conduct anonymous surveys focusing on management’s involvement in safety initiatives.
- Track participation rates in safety meetings and training sessions.
- Monitor the frequency and responsiveness to reported safety concerns.
A strong management commitment to safety establishes trust and encourages employees to engage actively in safety programs, leading to a reduction in workplace incidents.
12. Employee Training Completion Rate
This health and safety KPI measures the percentage of employees who have completed mandatory safety training within a specified timeframe.
Training Completion Rate = (Number of Employees Who Completed Training / Total Number of Employees Required to Undergo Training) × 100
High training completion rates ensure your workforce is prepared to handle job-specific risks, follow safety protocols, and respond effectively in emergencies.
13. Productive Days Percentage
This safety metric evaluates the proportion of scheduled workdays that are completed without any safety-related disruptions.
Productive days = (Number of Incident-Free Workdays / Total Scheduled Workdays) × 100
It connects safety performance directly to operational efficiency. A higher percentage reflects a safer work environment and efficient workflows.
14. Health and Safety Prevention Costs
This health and safety KPI tracks the financial investment in proactive safety and risk mitigation measures. Some common expenses include:
- Safety training programs
- Personal protective equipment (PPE)
- Safety audits and inspections
- Equipment upgrades
Investing in preventive measures can lead to long-term cost savings by reducing the frequency and severity of workplace incidents, lowering potential liabilities, and enhancing employee well-being.
15. Fatalities
Fatalities are a lagging indicator that records the number of work-related fatalities within a specific period. Here’s how to measure fatalities:
- Maintain accurate records of all fatal incidents.
- Classify by cause, department, and location.
- Conduct thorough investigations to identify root causes.
- Implement corrective actions to prevent recurrence.
Fatalities reflect severe safety failures. Tracking them helps identify areas requiring immediate attention to prevent future tragedies.
Measure HSE KPIs & Improve Performance with GoAudits Safety App
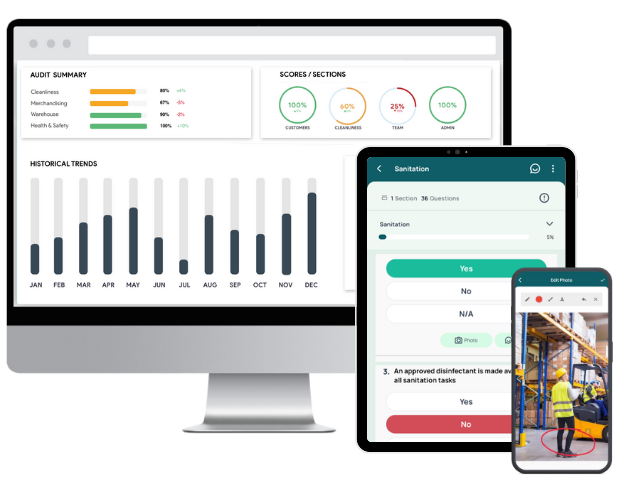
GoAudits is your all-in-one safety inspection platform to measure key HSE performance indicators with precision. It eliminates manual effort, enhances transparency, and streamlines every stage of the audit process, from inspection to corrective action, using mobile-first tools and real-time analytics. Here’s how you can use GoAudits safety inspection software to strengthen your health and safety performance.
- Start fast with industry-specific health and safety audit templates or build checklists tailored to your business. Use the intuitive drag-and-drop interface to create checklists that reflect your safety protocols, or let us do it for you at no additional cost.
- Conduct detailed workplace inspections even without an internet connection. Capture, annotate, and attach photos in-app to provide instant visual context. E-signatures, automatic timestamps, and GPS location ensure accountability.
- Generate complete, professional reports immediately after inspections. Reports are pre-filled with inspection data, images, corrective actions, etc. Automatically share reports with designated team members.
- During audits, assign corrective actions to individuals with deadlines and priorities. Central dashboards provide real-time views of action statuses, overdue tasks, and resolution timelines.
- Set up your company’s hierarchy and define rules for task assignment, approvals, and escalation based on roles and locations. Keep stakeholders informed with automated email alerts for pending reviews or tasks.
- Monitor audit scores and performance, task status, and trends. Detect patterns in recurring issues, and track scheduled audits, action plans, and compliance progress – all in one place.
Free & Customizable Health & Safety Checklists
GoAudits offers the following health and safety audit templates. You can sign up for free and start using these checklists.
- Near Miss Incident Report
- Worksite Incident Report Checklist
- Accident Investigation Checklist
- Quarterly Safety Audit
- Electrical Safety Inspection Checklist
- Fire Safety Inspection Checklist
- Chemical Safety Checklist – COSHH
- Scaffold Safety Checklist
- Facility Safety Inspection Checklist
- Job Safety Analysis (JSA) Checklist
- Office Safety Inspection Checklist
- Workplace Safety Checklist

How to Choose the Right Health and Safety KPIs to Measure?
Choosing the right health and safety KPIs is essential to maintaining a safe workplace and driving continuous improvement. Here’s how to do it effectively.
- Start by applying the SMART framework. Each HSE performance indicator you choose should be specific, measurable, achievable, relevant, and timely.
- Choose a balanced mix of leading and lagging indicators. Leading Indicators are proactive measures that predict and prevent incidents while lagging Indicators are proactive measures that reflect past performance. It helps you shift from a reactive to a preventive safety culture.
- Ensure each HSE KPI supports your organizational goals. If your company emphasizes operational continuity, focus on minimizing disruptions from incidents. If the priority is regulatory compliance, measure audit outcomes and corrective action timelines.
- Use industry benchmarks to validate and contextualize your health and safety KPIs. Compare your metrics with peers to identify performance gaps, set realistic improvement targets, and maintain competitiveness and compliance with industry norms.
- Leverage technology to streamline data collection and analysis. Modern safety management systems (SMS) provide real-time insights and reduce manual errors. They help uncover trends, visualize performance, and inform decision-making. Automating reports ensures consistent monitoring and quicker response to emerging risks.
FAQs
Track health and safety KPIs by implementing a structured, transparent reporting process that captures all incidents, near-misses, and unsafe behaviors in real time. Encourage honest and anonymous reporting, while fostering a no-blame culture that prioritizes learning over punishment. Regularly gather feedback from employees to identify gaps in safety practices and perception. Review data consistently, analyze patterns, and ensure managers act on findings to improve safety measures. Clear documentation and dashboard visualization help maintain visibility and accountability across all departments.
Use health and safety KPIs to proactively identify trends and potential hazards before they escalate. Monitor leading indicators like safety training completion rates, equipment inspection frequency, and near-miss reports to address risks early. Analyze lagging indicators to evaluate the effectiveness of current controls. Share insights with teams to reinforce awareness and accountability. Integrating KPI data into continuous improvement cycles can strengthen safety culture, refine protocols, and lower the frequency and severity of workplace incidents.
Measuring HSE KPIs presents challenges like inconsistent data reporting, lack of real-time tracking systems, and unclear definitions of safety metrics across departments. Variability in how incidents are classified or reported can skew analysis and hinder accurate benchmarking. Fear of repercussions or underreporting of near-misses also impacts data quality. Additionally, relying too heavily on lagging indicators without integrating leading metrics limits foresight.
Safety KPIs in manufacturing measure both reactive and proactive elements of workplace safety. Common metrics include TRIR, LTIFR, and the number of near-miss reports. Leading indicators may cover machine safety audits, compliance with PPE usage, safety training participation, and behavior-based observations. They help identify operational risks, evaluate the effectiveness of safety protocols, and ensure regulatory compliance. Regular analysis supports data-driven decisions that enhance worker safety and operational efficiency on the factory floor.
In construction, safety KPIs track risk exposure and compliance on dynamic job sites. Examples include the number of safety inspections conducted, near-miss reports, incident rates per 100,000 hours worked, and time to close corrective actions. Other KPIs measure toolbox talk frequency, equipment safety checks, and worker certification levels. They help manage high-risk activities, such as working at height or with heavy machinery, by highlighting trends and preventing recurring issues.